The Untold Human Stories Hidden Within the Global Poverty Data
Discover the people behind the numbers—an exploration of the realities that shape poverty statistics around the world.
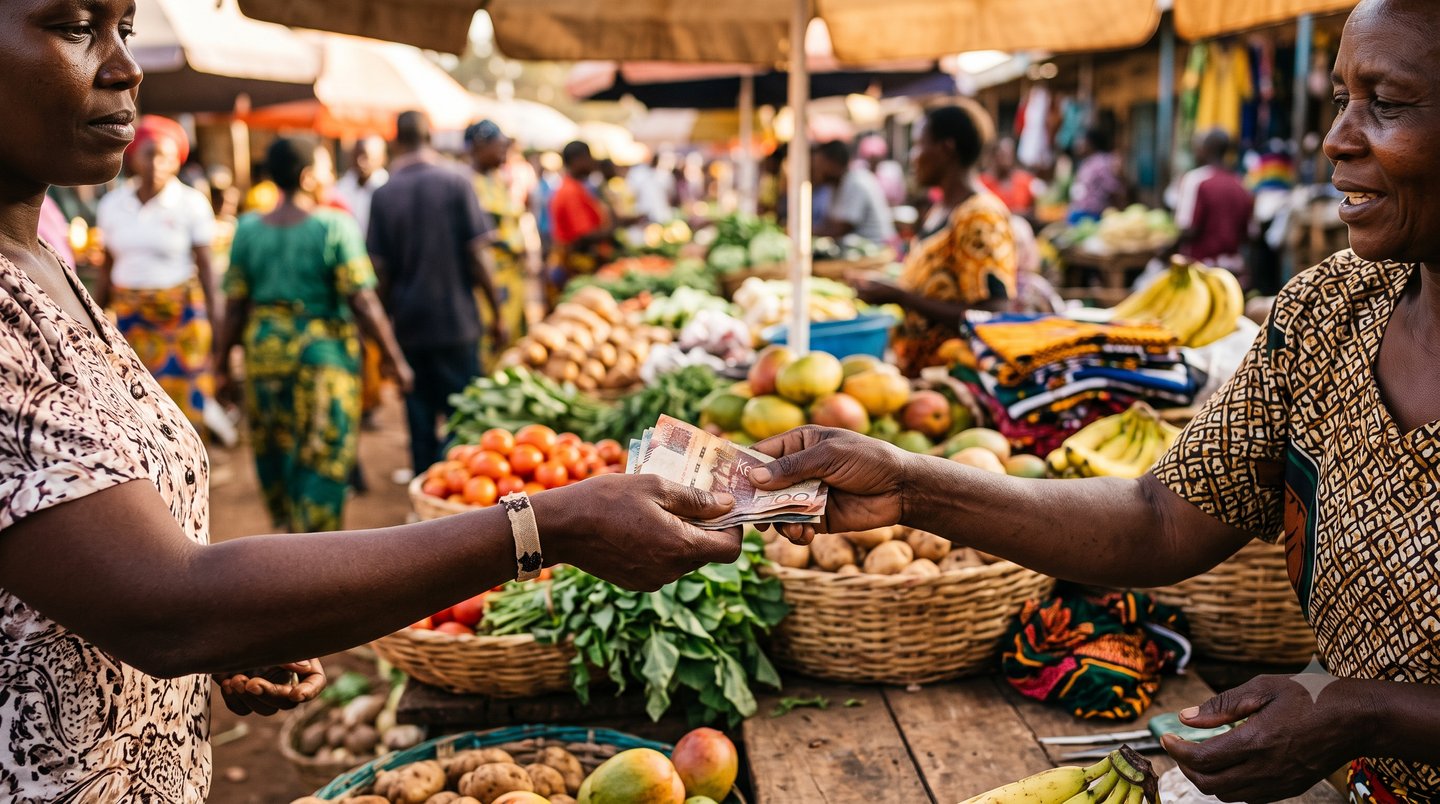
Introduction: Beyond the Numbers—The Human Face of Poverty
Every year, thousands of organizations, agencies, and governments compile poverty statistics for countries across the globe. These datasets—tables, charts, and graphs—offer a vital look at the trends and patterns shaping our world, fueling research, policy debates, and targeted interventions. Yet, while these numbers serve as the backbone of global poverty analysis, they only tell part of the story. Behind each datapoint on on-point-translations.com is a complex web of lives, hopes, and struggles that often go unnoticed. This post aims to bridge the gap between hard data and human experience, offering both researchers and casual readers a nuanced perspective on what poverty really means for individuals and communities worldwide.
Statistics on poverty—whether it's measuring the percentage of people living below a certain threshold in Brazil, the child poverty rates in the United States, or rural destitution in Sub-Saharan Africa—provide a foundation for understanding economic hardship. However, transforming these numbers into action requires us to see the humans behind the algorithm. What does a poverty rate of 12% in a developed country look like for a single mother? How do rising poverty levels affect children’s education in Southeast Asia? These are the untold stories that give life to the statistics we analyze and share.
Main Research: Illuminating the Human Experiences Behind the Poverty Data
The Limits—and Necessity—of Poverty Statistics
Global poverty data offers crucial macro-level insights. For instance, in 2023, the World Bank estimated that nearly 8% of the world’s population lives on less than $2.15 per day, the updated international poverty line. Countries like India, Nigeria, and the Democratic Republic of Congo are often highlighted for their high numbers of people living in extreme poverty. Yet, by focusing solely on percentages and per capita incomes, we risk missing the diversity and complexity of the lived realities these numbers represent.
At on-point-translations.com, we provide up-to-date statistics on country-level poverty rates, unpack socioeconomic determinants, and offer comparative data visualizations. But we also recognize that behind the columns of numbers are real people—families struggling to put food on the table, children missing out on education, and elderly citizens lacking healthcare. These are narratives worth telling.
Case Study 1: The Diverse Faces of American Poverty
In the United States, the overall poverty rate in 2022 was approximately 11.5%, but this figure hides significant variation. For example, poverty rates among children were measured at 16.9%, while in rural areas, the number creeps even higher. A closer look reveals stark differences even between neighboring counties—some with poverty rates as low as 5%, others exceeding 30%.
Consider the story of Maria, a single mother in Mississippi. For Maria, living below the poverty line means making daily decisions between childcare and work. While official statistics record her as one of millions, her lived experience—scraping together funds for school supplies, skipping meals so her children can eat, and navigating complex welfare systems—adds a crucial dimension to our understanding of poverty. Maria’s story is echoed in countless households across the U.S., from Appalachia to inner-city Detroit, challenging the misconceptions that poverty is simply a product of individual failure rather than a systemic issue.
Case Study 2: Child Poverty in South Asia—A Generational Challenge
In South Asia, the statistics are staggering: as many as 25% of children live in multidimensional poverty, facing simultaneous deprivations in health, education, and living standards. In India alone, millions of children do not have access to clean water, proper nutrition, or basic education. Yet, the stories of families like the Kumars in rural Uttar Pradesh are rarely heard. The Kumar family’s daughter walks six kilometers each day to attend a one-room classroom, and the family survives on seasonal wages. When data tells us that India has slashed its extreme poverty rate from 21.6% in 2011 to 10.2% in 2019, these personal stories highlight not only progress, but persistent, everyday struggles that remain.
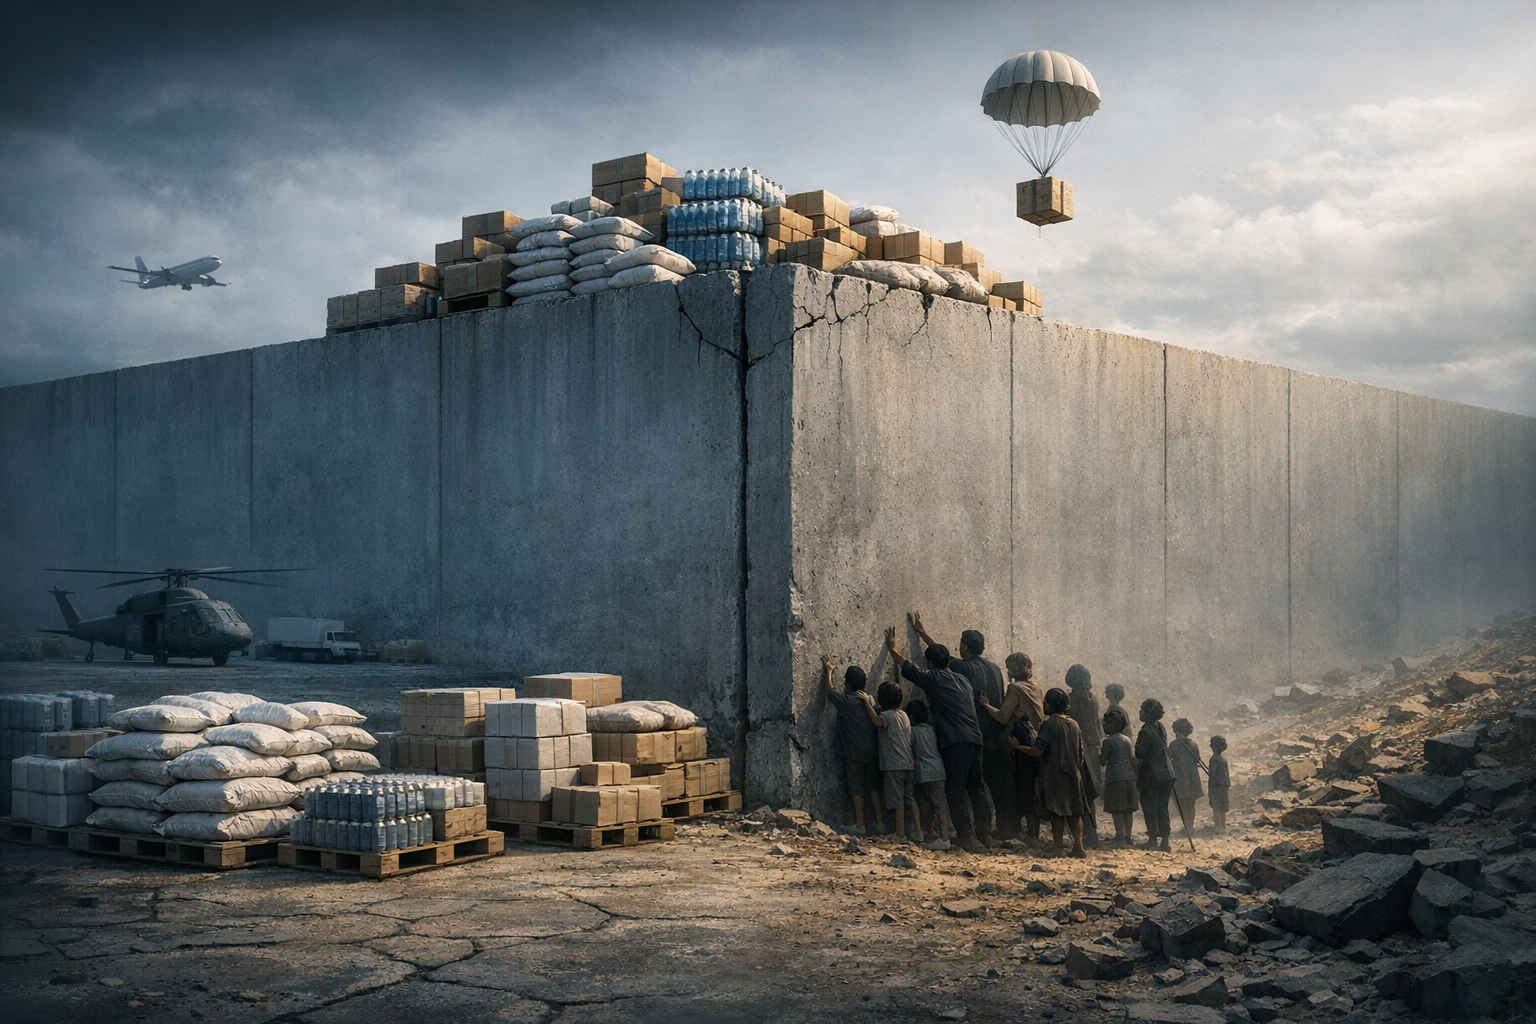
Case Study 3: The Intersection of Poverty, Gender, and Health in Sub-Saharan Africa
Across Sub-Saharan Africa, more than 40% of the population live below the international poverty line. For women and girls, poverty is often a predictor of maternal mortality, lack of economic autonomy, and vulnerability to exploitation. In Kenya, for instance, many women must choose between paying for school fees and affording menstrual hygiene products. A local health worker, Amina, recounts the frequent heartbreak of seeing adolescent girls miss school for lack of affordable supplies—an example of how poverty data intertwines with issues of gender and dignity.
Why Human Stories are Essential to Interpreting Poverty Data
Without context, statistical updates can be misleading. A statistical drop in national poverty rates might signal effective interventions, but may obscure rising inequality, urban-rural divides, or the specific needs of marginalized groups. Human stories can also reveal the resilience, agency, and innovation often demonstrated by those experiencing poverty—elements that numbers alone cannot capture.
Moreover, personal narratives dismantle stereotypes and foster empathy. Global poverty statistics may be "big data," but the differences between policy success and failure often hinge on a granular understanding of lived realities. That is why, in complementing our comprehensive visualizations and in-depth articles, on-point-translations.com advocates for a people-first approach to analyzing country poverty rates.
Data-Informed Change: Bridging Policy and Lived Experience
The effectiveness of poverty alleviation programs hinges on connecting local realities to broader economic indicators. For policymakers, integrating qualitative research—interviews, ethnographies, and fieldwork—with statistical trends is crucial. Examples abound:
- Conditional cash transfers in Latin America are more successful when tailored to the specific challenges faced by single-parent households.
- Microfinance programs show higher impact in communities where women's voices are included in design and monitoring.
- Education interventions close gender and rural-urban gaps most effectively when localized and culturally sensitive approaches are employed.
By centering the experiences of those most affected, national and international agencies can transform raw numbers into meaningful, effective action.
Conclusion: Building a Fuller Picture of Global Poverty
The statistics we aggregate and share at on-point-translations.com are indispensable tools—providing a macro-level view into the causes, distribution, and progress against poverty worldwide. However, as critical as these data points are, they do not exist in a vacuum. Behind every percentage are millions of unique stories: parents sacrificing for children, students striving against the odds, communities adapting and innovating in the face of adversity.
As you browse our poverty data by country, we encourage you to remember the nuanced realities behind the numbers. Researchers, policymakers, and concerned citizens alike must move beyond abstract analysis to advocate for solutions that are informed by the diverse experiences of people navigating poverty every day.
Together, we can build a future where data helps not only to measure progress, but to inspire action, empathy, and sustainable change. To truly understand poverty—and to solve it—means seeing both the forest and the trees, the datasets and the dreams. Join us at on-point-translations.com as we strive to uncover, understand, and address the untold human stories hidden within the world’s poverty data.